

The Cost of Recovery
Most investors understand volatility.
What is often underestimated is how long recovery can take once capital is impaired.
A drawdown is not always just a temporary decline in value. In many cases, it can represent years spent trying to rebuild what was lost.
For investors relying on portfolios to generate income, preserve purchasing power, or fund long-term obligations, time matters.
And historically, recovery has not always come quickly.
The “Lost Decade”
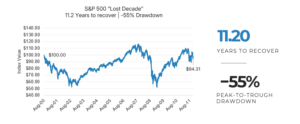
The S&P 500 from 2000 through 2011 remains one of the clearest examples of how long recovery periods can last.
The index experienced a peak-to-trough decline of approximately 55%, requiring more than 11 years to fully recover.
For many investors, the challenge was not simply enduring volatility.
It was the length of time spent attempting to rebuild capital.
That distinction matters, particularly for investors who depend on portfolios not just for growth, but for consistency and reliability over time.
Fixed Income Faced Its Own Test
For years, traditional fixed income was viewed as the stabilizing portion of a portfolio.
Recent years challenged that assumption.
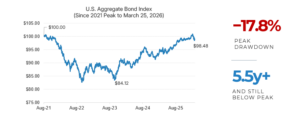
The U.S. Aggregate Bond Index experienced one of the largest drawdowns in its history, and even years later remained below previous highs.
The lesson was not that bonds no longer matter.
It was that even traditionally defensive allocations can experience extended recovery periods under the wrong market conditions.
A Different Objective
At Garrington Private Credit, our focus has always been on durability through different market environments.
Because for many investors, the greatest challenge is not short-term volatility itself.
It is losing years trying to recover from it.
Our strategy focuses on short-duration, senior secured, asset-based loans backed by tangible collateral and structured with capital preservation in mind.
Garrington Solution | Consistency of Rolling 12-Month Net Returns 1
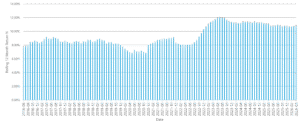
The objective is not to maximize yield at any cost.
It is to pursue attractive risk-adjusted returns while emphasizing consistency, durability, and the return of capital across varying market environments.
Final Thought
Large drawdowns do more than reduce portfolio values.
They consume time.
And in investing, time can be one of the hardest things to recover
1The “Historical Net Performance – Garrington Private Debt Strategy” shown from January 1, 2021 to present is of the Garrington Private Credit Fund (the “Fund”) Class I Shares net of all fees and expenses. The performance results highlighted above from June 1, 2015 to December 31, 2020 is of Garrington’s performance history which is based on an asset-weighted composite comprised of transactions managed by Garrington in various Special Purpose Vehicles (NELI Financial Incorporated, NELI International Incorporated, NELI Canada LP and NELI Canada II LP, collectively, the “Garrington SPV’s”) (the “Performance Composite”) during this period. The Performance Composite has been calculated net of all fees and expenses. The Performance Composite calculations have been reduced by an additional 0.75% management fee and a performance fee of 20% over an 8% hurdle rate (with a catch-up) to properly reflect the fees of the Class I shares of the Fund. Collectively, the Historical Net Performance and the Performance Composite are the Fund’s “Related Performance”. There may be material differences between the returns of the Fund and the Related Performance, including, but not limited to the structure, redemption provisions, fees, use of leverage, taxes, currency hedging, foreign exchange, loan portfolios not being identical, cash flows and asset size. Related Performance results have inherent limitations, some of which are described above, so there may be material differences between the Related Performance results and the actual record subsequently achieved by the Fund. The Fund changed its name from the Coral Cove Private Credit Fund to the Garrington Private Credit Fund on July 17, 2024. The historical annualized rates of return for the Garrington Private Credit Fund Class I Shares as of April 30, 2026, are 1 year 10.92%, 3 year 11.09%, 5-year 10.57% and CARR 10.45%.
Subscribe
Have our blog delivered directly to your inbox: