Private Credit Under Pressure: Why Structure Matters More Than Scale
In the past six months, private credit has moved from the business pages to the front pages. Federal fraud indictments. Emergency liquidations. Halted redemptions. The names now dominate the headlines: Tricolor Holdings, First Brands Group, Renovo Home Partners, BlackRock TCP, and most recently, Blue Owl Capital. We have addressed several of these situations in previous communications to our investors, but taken together they have raised a single, urgent question: does private credit still work?
The answer is yes; but not all private credit is the same. The events now playing out in courtrooms and bankruptcy proceedings share common features: structural complexity, opaque valuations built on enterprise value rather than tangible assets, excessive leverage, and the relentless deployment pressure that comes with managing tens of billions of dollars. These are not problems inherent to private credit as an asset class. They are problems that emerge when private credit is industrialised.
Garrington has been managing private credit since 1999. We have navigated the Global Financial Crisis, a global pandemic, and multiple credit cycles without a single negative rolling twelve-month return since we began managing 3rd party investor capital in 2015. We have done this not by being larger or more complex than our peers, but by being smaller, simpler, and more disciplined. This paper explains why that distinction matters, particularly now.
What Went Wrong
The recent headlines are not a single story. They represent three distinct types of situations, each with different implications for investors.
Collateral That Did Not Exist
Tricolor Holdings: was a subprime auto lender that quadrupled in size over five yearsi before filing for Chapter 7 liquidation in September 2025ii. Federal prosecutors have since revealed a systematic fraud: the company pledged the same vehicle loans as collateral to multiple lenders simultaneously, creating an asset-liability gap of over $800 millioniiiiv. JPMorgan, Barclays, and Fifth Third Bancorp collectively absorbed more than $500 million in losses. The company’s founder faces federal criminal charges1.
First Brands Group: the parent of household automotive brands including FRAM, TRICO, and Raybestos — filed for Chapter 11 in September 2025 and has since shifted to forced liquidation. In what is being called the largest asset-based lending fraud in recent history, investigators allege the company fabricated approximately $2.3 billionv in invoices and double-pledged inventory to multiple lenders through off-balance-sheet special purpose vehicles. Senior debt is trading at 13 to 16 centsvi on the dollar. A cooperating witness has pleaded guilty to eight counts of fraud in connection with the schemevii.
The common thread: In both cases, the scale and complexity of the lending structures outpaced the rigour of the oversight. Multiple competing lien holders, off-balance-sheet vehicles, and a “big bank” approach to monitoring credits that demanded far more hands-on scrutiny — these created the conditions for collateral misrepresentation to go undetected. The security behind the loans existed on paper, but the infrastructure to scrutinize it did not match the risk.
Enterprise Valuations that Evaporate Overnight
Renovo Home Partners was a private-equity-backed roll-up that acquired dozens of regional remodelling brands. As late as September 30, 2025, BlackRock’s TCP Capital BDC and other lenders valued their loans to Renovo at 100 cents on the dollarviii. Six weeks later, the debt was written to zero. Renovo filed directly for Chapter 7 (no restructuring, no reorganisation) with court filings revealing less than $100,000 in assets against $100 million to $500 million in liabilitiesix.
More broadly, BlackRock TCP Capital experienced approximately a 19% decline in net asset valuex, with roughly two-thirds of the write-downs concentrated in just six portfolio companies, four of them in technology sectors including education technology, e-commerce, and mobile advertising. These were businesses valued on enterprise metrics, revenue multiples, projected EBITDA, comparable transactions, rather than on the liquidation value of tangible assets.
The common thread: Enterprise valuations, particularly for technology and PE-backed businesses, can move from par to zero with extraordinary speed. When the collateral behind a loan is a going-concern valuation rather than a physical asset that can be independently appraised and liquidated, the security is only as stable as the business model.
Liquidity Mismatches and the Pressure of Scale
Blue Owl Capital is a large, well-established asset manager with a strong track record in private credit, which makes what followed all the more instructive. After a proposed merger between two of its BDC funds was abandoned in late 2025 amid investor backlash, the firm permanently halted redemptions at one fund in February 2026 and executed $1.4 billionxi of asset sales across three vehicles to return capital and pay down debt. The assets sold at 99.7 centsxi on the dollar, validating the portfolio’s markings. But the fact that the sale was necessary at all underscored a structural challenge facing many large private credit platforms.
The episode exposed a tension inherent in many evergreen private credit vehicles: offering periodic liquidity against multi-year illiquid loans creates a maturity mismatch that can force asset sales under pressure. This is a challenge the entire industry must manage, not a failing unique to any one firm. However, the risk is amplified by scale: research by Adams Street Partners has estimated that the managers of the four largest perpetual BDCs must collectively deploy approximately $23 billion annually just to remain fully investedxii. That level of deployment pressure can compromise selectivity, underwriting standards, and the ability to walk away from a deal.
How Garrington is Built Differently
Garrington is not simply a “better managed” version of the platforms described above. Our model is architecturally different and designed from the ground up to avoid the specific structural vulnerabilities that the current crisis has exposed.
We Lend Against Assets We Can Touch, Value, and Liquidate
The foundational difference between Garrington and the large-scale direct lenders is the nature of our collateral. We lend primarily against tangible, independently verifiable assets: inventory, equipment, receivables, real estate, and secured loan portfolios, where we can form a clear view of realisable value. Our focus is on what the collateral is worth today and what it would fetch if we needed to enforce, not on projections of future business performance or enterprise value.
This distinction is not cosmetic. In the Tricolor and First Brands cases, complex multi-lender structures and insufficient hands-on scrutiny allowed collateral misrepresentation to go undetected for years. At Garrington, as almost always the sole senior secured lender, we maintain direct oversight of the assets securing our loans, with the ability to inspect, appraise, and enforce our security position without navigating competing lien holders. In the Renovo and BlackRock TCP cases, the “collateral” was effectively the enterprise value of the borrower, a number derived from EBITDA multiples and comparable transactions that can collapse to zero in weeks. Our collateral is physical. It exists in warehouses, on balance sheets, and in property registries. It can be inspected, appraised, and sold.
We structure substantially all of our loans as first-position liens on the borrower’s business and its assets and set advance rates conservatively against our assessment of realisable collateral value (often independently assessed liquidation values), not against going-concern valuations or multiples-based enterprise valuations. The result is a portfolio with a weighted-average loan-to-value ratio, measured against realisable collateral value, not enterprise value, that has historically ranged between 50% and 70%, currently standing at 61%.
Weighted-Average Loan-to-Value Ratio

We Operate Where the Mega-Funds Cannot
Garrington focuses on lending in the $1 million to $30 million range, a segment that is structurally underserved because the operational complexity of managing smaller transactions does not align with the return thresholds and deployment targets of large-scale platforms. Where a fund that must deploy over ten billion per year needs large, syndicated deals to move the needle, we originate bespoke facilities for small and lower-middle-market businesses across the United States and Canada.
The result is less competition, better terms, and greater selectivity. When we are often the only credible lender at the table, we set the covenants, the reporting requirements, and the advance rates. Numerous studies, including research from Preqin, Cambridge Associates, Pitchbook, and McKinsey suggest that smaller, niche private credit strategies have historically outperformed their large-scale counterparts on a risk-adjusted basis.
Garrington vs. Typical Large BDC: Key Structural Differences

Short Duration, Natural Liquidity, Modest Leverage
Some of the largest private credit platforms have operated with significantly higher leverage ratios, in some cases between 0.8x and 1.25x debt-to-equity, while offering quarterly or less frequent liquidity against multi-year illiquid loans. Garrington’s structure is designed around the opposite principle.
Our loans have a weighted-average duration of approximately 200 days23, with roughly 60% of the portfolio maturing within six months. This means the book is constantly generating cash through natural repayments, amortisation, and refinancing, creating an organic liquidity cycle that aligns with our monthly investor liquidity (subject to a 90-day notice period). We plan to never be in a position where we must force-sell assets to meet redemptions.

We target a debt-to-equity ratio of 0.5x, with operating levels typically between 0.25x and 0.75x. The current ratio is 0.44x. Our returns are generated through careful deal selection and structuring, not through financial engineering or leverage.
No evergreen private credit vehicle is entirely immune to liquidity mismatch — including Garrington. Our current portfolio benefits from a short weighted-average duration and a meaningful allocation to short-term factoring facilities, but that profile could shift if we originate or renew loans with longer maturities, or if our portfolio mix evolves. The difference is one of degree and design: our credit facilities provide structural flexibility, our leverage is modest, and our loan book naturally generates cash at a pace that has historically aligned well with investor redemption patterns. We manage this tension actively rather than assuming it away.
Current-Pay, Cash-Generating Loans
Almost all loans in the Garrington portfolio pay interest in cash on a monthly basis. Our exposure to payment-in-kind (PIK) structures is negligible, historically averaging less than 1% of the portfolio. This is a meaningful distinction in an industry where cash-to-PIK conversions and debt-for-equity swaps are increasingly being used to mask deteriorating credit quality and delay inevitable defaults.
Valuation Discipline and Third-Party Oversight
The Renovo write-down, from par to zero in six weeks, has rightly focused attention on how private credit portfolios are valued. At Garrington, the nature of our lending means our valuations are inherently more stable and verifiable. Our loans are short-duration and backed by tangible collateral with independently assessed liquidation values. There are no complex derivatives, no enterprise-value positions subject to model risk, and no exposure to sectors where AI-driven disruption is calling future cash flows into question.
Our valuation framework incorporates quarterly independent valuation engagements, monthly reporting to and ongoing transparency with our bank credit facility providers, semi-annual field examinations by those banks, and annual external audits of financial statements.
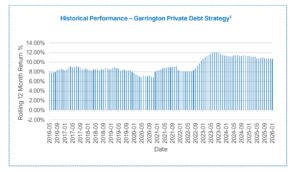
The Evidence: Consistency Across Cycles
Garrington targets average annual net returns of 8% to 11%, with no negative rolling twelve-month periods. Since the inception of the strategy, we have delivered on both objectives. The portfolio has typically generated gross yields exceeding 13%, with current-pay monthly interest, conservative advance rates, and a bad-debt expense that has averaged well below 1% of net funded exposure over the life of the strategy.
Looking Forward
The increased scrutiny being applied to private credit is warranted, and we welcome it. The fraud at Tricolor and First Brands, the valuation cliff at Renovo, and the liquidity crisis at Blue Owl are not aberrations — they are the predictable consequences of complexity, opacity, and scale-driven deployment pressure in an asset class that has grown faster than its risk infrastructure.
We believe this environment favours managers like Garrington. Our model was not designed for a benign market — it was designed for exactly this moment: when investors are asking hard questions about what their collateral is actually worth, whether their manager can meet redemptions without fire sales, and whether the returns they are earning justify the risks embedded in their portfolio.
At Garrington, the answers to those questions have not changed in twenty-six years of managing private credit. We lend against real assets. We verify what we own. We collect cash interest every month. We match our liquidity to our loan book. And we do not grow for the sake of growing.
We win by not losing.
Sources
i Seeing Red Flags: Tricolor — A Colorful Lesson in Collateral Interests
ii JPMorgan, Barclays, Fifth Third Sued Over Tricolor Fraud
iii Investors Sue JPMorgan and Barclays Over Tricolor Securities Deal
iv Tricolor Holdings Bankruptcy Overview
v First Brands Chapter 11 Filing — Shumaker Client Alert
vi Bloomberg: First Brands Considers Chapter 7 Liquidation
vii U.S. Department of Justice: First Brands Executives Charged in Multibillion-Dollar Fraud
viii BlackRock Faces 100% Loss on Private Loan
ix National Home Renovation Brand Files for Bankruptcy
x BlackRock TCP Capital 2025 Financial Results
xi Blue Owl Sells $1.4B in Loans and Halts Redemptions
xii Adams Street Partners: Private Credit Hyperscalers
Disclaimers
1 The “Historical Performance – Garrington Private Debt Strategy” and the “Annualized return since inception” shown from January 1, 2021, to present are of the Garrington Private Credit Fund (the “Fund”) Class I Shares net of all fees and expenses. The performance results from June 1, 2015, to December 31, 2020, reflect Garrington’s performance history based on an asset-weighted composite comprised of transactions managed by Garrington in various Special Purpose Vehicles (collectively, the “Garrington SPVs”) (the “Performance Composite”) during this period. The Performance Composite has been calculated net of all fees and expenses. The Performance Composite calculations have been reduced by an additional 0.75% management fee and a performance fee of 20% over an 8% hurdle rate (with a catch-up) to properly reflect the fees of the Class I shares of the Fund. Collectively, the historical Fund Performance and the Performance Composite are the Strategy’s “Related Performance”. There may be material differences between the returns of the Strategy and the Related Performance, including, but not limited to, the structure, redemption provisions, fees, use of leverage, taxes, currency hedging, foreign exchange, loan portfolios not being identical, cash flows, and asset size. Related Performance results have inherent limitations, some of which are described above, and there may be material differences between the Related Performance results and the actual record subsequently achieved by the Strategy. The Fund changed its name from the Coral Cove Private Credit Fund to the Garrington Private Credit Fund on July 17, 2024.
2 All figures and data regarding the Garrington Private Credit Strategy portfolio are unaudited and derived from unaudited data as at the date indicated herein. All data and calculations for the Garrington overall portfolios as at January 31, 2026, are subject to change and may slightly vary depending on which Garrington Fund is investing. As of March 1, 2026, the Strategy is invested in a portfolio of loans which may differ by individual positions and/or percentage weightings from the data indicated in this section due to ongoing portfolio transactions.
3 Calculated as loan balance divided by estimated collateral value. Collateral values are unaudited and may reflect a range depending on valuation methodologies, including Use Value, Orderly Liquidation, and Forced Liquidation valuations. Collateral calculations are typically limited to assets held directly by the borrower or for which the Strategy is directly entitled. As at January 31, 2026, for two lender-to-lender transactions, an “Economic LTV” is utilized, representing a modeled expected-case estimate of proportional exposure to downstream borrower collateral. For these calculations, the LTV is calculated as the advance rate against the lender finance loan portfolio multiplied by the weighted-average borrower-level LTV of that portfolio.
4 Based on the legal maturity date of the loan. Loans are subject to renewal and/or extension. Factoring facilities are typically structured through ongoing purchase and sale agreements for the factoring of receivables and may not have an explicit maturity date. For analytical purposes, an estimated average period of 90 days has been used for the full collection of factored receivables and the maturity timing of factoring facilities.
Subscribe
Sign up to receive our blogs directly to your inbox.