What Actually Drives Returns?
Correlation gets a lot of attention in investing. What drives that correlation matters just as much.
Many asset classes ultimately respond to the same underlying forces — interest rates, market sentiment, liquidity conditions, broad economic cycles. When those pressures emerge, positions that once looked diversified can start moving together.
That is why understanding the source of returns matters.
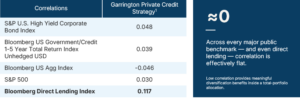
At Garrington Private Credit, our strategy has historically shown low correlation not only to public equities and traditional fixed income, but even to broader direct lending benchmarks. The reason is rooted in what actually drives the underlying cash flows within the portfolio.
Many private credit strategies are tied closely to duration risk, credit spreads, leverage, or broader market repricing. Others may rely heavily on long-term enterprise valuations or syndicated market activity.
Our approach is different.
Returns are primarily from short-duration, self-amortizing loans backed by tangible collateral and structured with capital preservation in mind.
The repayment of invoices. The movement of inventory. The refinancing of real businesses through normal operating cycles. These are the underlying drivers of return.
A Different Source of Diversification
Diversification is often thought of in terms of asset labels.
Stocks. Bonds. Private Credit.
But true diversification comes from exposures that behave differently under stress because they are driven by different underlying cash flows.
When Markets Declined, Capital Was Protected
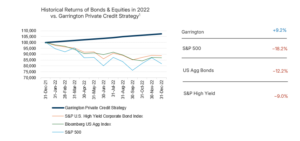
For us, low correlation has never been the objective on its own.
It has been the byproduct of a strategy built around structure, collateral, duration, and disciplined underwriting.
Final Thought
Portfolios are built to behave differently across market environments. That is why diversification matters — and why correlation matters.
When markets come under stress, investors do not experience diversification as a theory. They experience it in real time, through the behaviour of their portfolio.
Historically, our strategy has shown low correlation not only to public markets, but even to broader private credit benchmarks — because the underlying drivers of return are fundamentally different.
For us, that distinction is significant.
1 The “Historical Net Performance – Garrington Private Debt Strategy” shown from January 1, 2021 to present is of the Garrington Private Credit Fund (the “Fund”) Class I Shares net of all fees and expenses. The performance results highlighted above from June 1, 2015 to December 31, 2020 is of Garrington’s performance history which is based on an asset-weighted composite comprised of transactions managed by Garrington in various Special Purpose Vehicles (NELI Financial Incorporated, NELI International Incorporated, NELI Canada LP and NELI Canada II LP, collectively, the “Garrington SPV’s”) (the “Performance Composite”) during this period. The Performance Composite has been calculated net of all fees and expenses. The Performance Composite calculations have been reduced by an additional 0.75% management fee and a performance fee of 20% over an 8% hurdle rate (with a catch-up) to properly reflect the fees of the Class I shares of the Fund. Collectively, the Historical Net Performance and the Performance Composite are the Fund’s “Related Performance”. There may be material differences between the returns of the Fund and the Related Performance, including, but not limited to the structure, redemption provisions, fees, use of leverage, taxes, currency hedging, foreign exchange, loan portfolios not being identical, cash flows and asset size. Related Performance results have inherent limitations, some of which are described above, so there may be material differences between the Related Performance results and the actual record subsequently achieved by the Fund. The Fund changed its name from the Coral Cove Private Credit Fund to the Garrington Private Credit Fund on July 17, 2024. The historical annualized rates of return for the Garrington Private Credit Fund Class I Shares as of April 30, 2026, are 1 year 10.92%, 3 year 11.09%, 5-year 10.57% and CARR 10.45%.
Subscribe
Have our blog delivered directly to your inbox: